1121: median line, trailing average and h-spread #1291
Conversation
|
✔️ Deploy Preview for koda-nuxt ready! 🔨 Explore the source changes: 9160039 🔍 Inspect the deploy log: https://app.netlify.com/sites/koda-nuxt/deploys/61b0082850bdce00082edaa3 😎 Browse the preview: https://deploy-preview-1291--koda-nuxt.netlify.app |
|
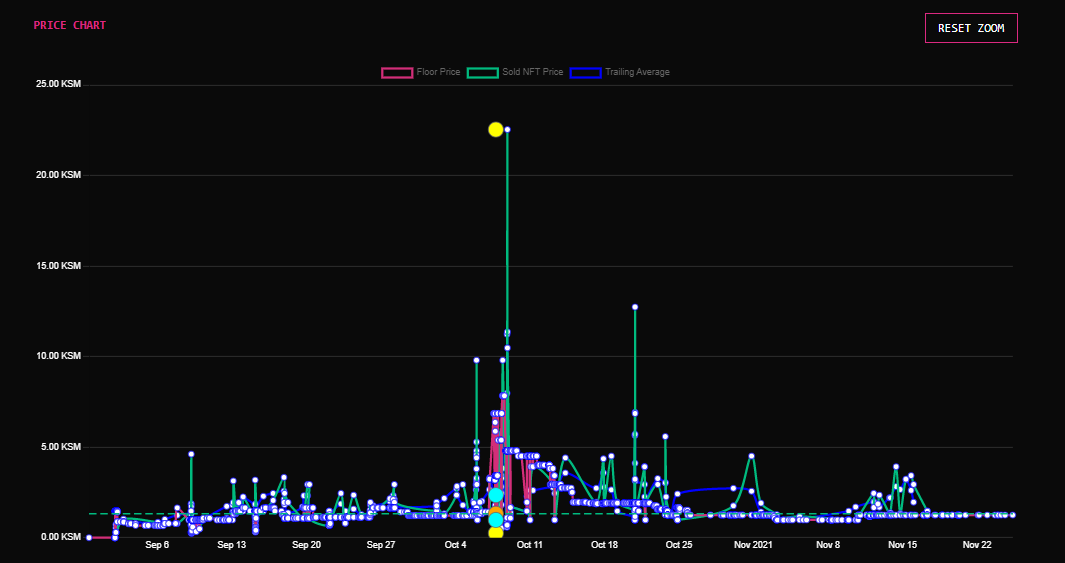
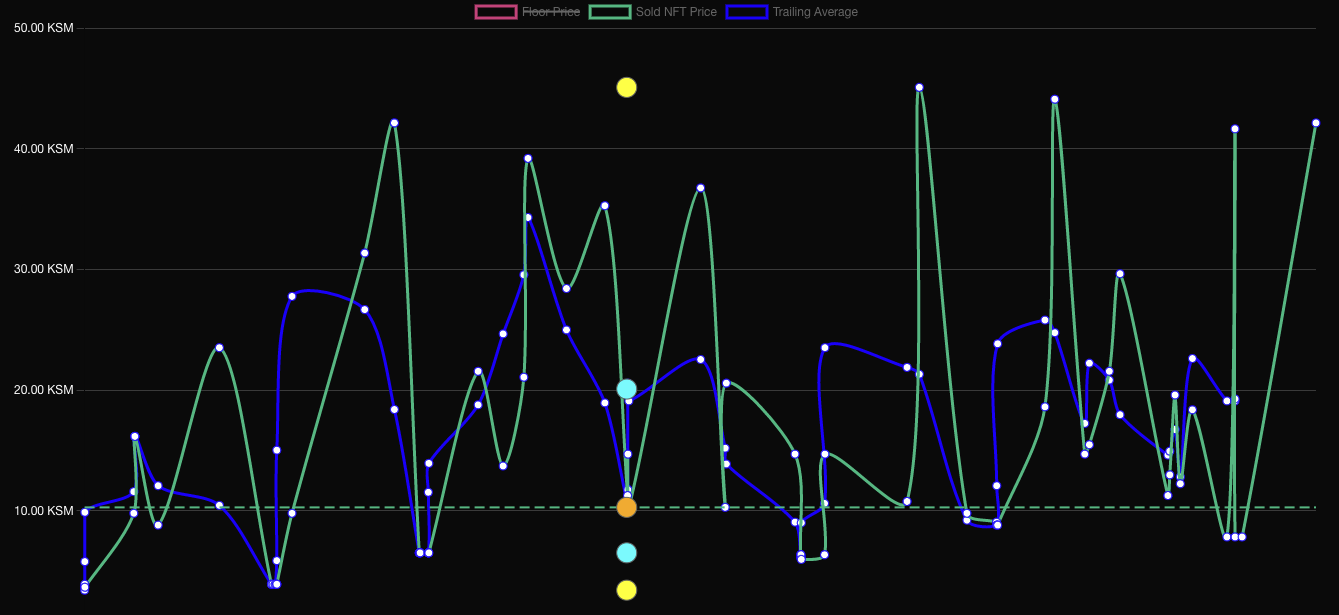
This PR is branched out from #1110 Hello @yangwao. Here's the current progress. H-spread (in-progress): The H-Spread values are derived from all values of the Sold NFT Price (having "Buy events"), sorted in ascending order then followed the logic for determining the values from these resource IQR implementation: Khan Academy: https://www.khanacademy.org/math/cc-sixth-grade-math/cc-6th-data-statistics/cc-6th-box-whisker-plots/v/box-and-whisker-plot-exercise-example I feel that the H-Spread was incorrect and would ask for guidance on this one. Should I gather all events from the Sold NFT Price (hence the result)? Should I just provide constant values for each point, for example [min=actual_point_value - 10, actual_point_value , max=actual_point_value + 10]? This will provide lots of box plots per point in the Sold NFT Price. Trailing average (asking for feedback): Watch the screen recording: https://screencast-o-matic.com/watch/crXTf3VIp8K |
|
hey @rhaicode, |
|
@rhaicode you probably need update PR as Netlify wasn't triggered, so whenever you add something new it should be building fine I guess if you push recent |
|
@yangwao you can now check the deployed build for this PR |
|
These dots are box plots my best guess? If so, let's make them outlined probably so it's not attention disruptive Looking at https://deploy-preview-1291--koda-nuxt.netlify.app/rmrk/collection/2644199cf3652aaa78-KK01
|
|
@yangwao no, these points actually draw a one big box plot with the tips of the box plot on the yellow dots, which I feel is incorrect. How are we going to derive values for the IQR? |
|
Hello @yangwao , I'm having difficulty in finding a way to support box plot charts with line charts. As you can see from this Codepen, it's only composed with box plots with the defined x-axis (for example months Jan, Feb, Mar, etc) without any line charts inside. I think this is the farthest development I can provide. |
|
Hey there, so let's put the box plot as a separate issue and we can add it later, what do you think? |
|
Hello @yangwao. These are the following only supported of this commit:
|
|
I would like test it but our partner Subquery who provides indexer is down for some unknown reason and put it into investigation, I feel really really bad about it #1481 |
|
Perfect, I’ve sent the payout https://kusama.subscan.io/extrinsic/0x4e13575846bb8044dc9ba4cd6cf3b64e6e51316dd3bd45417dcc7a4f01c52e0f Let’s grab another issue and get rewarded! I've created a separate issue for that h-spread in chart, |
Thank you for your contribution to the KodaDot NFT gallery.
👇 _ Do a quick check before the merge.
PR type
Before submitting Pull Request, please make sure:
Optional
What's new?
Had issue bounty label ?
Community participation
Screenshot