[ADD] Added first draft notebook for the multidimensional motif and m… #557
Conversation
…atches discovery tutorial
|
Check out this pull request on See visual diffs & provide feedback on Jupyter Notebooks. Powered by ReviewNB |
|
I was not sure if I am supposed to run black and flake8 on jupyter notebooks too, so I skipped these steps. |
Codecov ReportAll modified and coverable lines are covered by tests ✅
Additional details and impacted files@@ Coverage Diff @@
## main #557 +/- ##
=======================================
Coverage 99.89% 99.89%
=======================================
Files 80 80
Lines 11399 11453 +54
=======================================
+ Hits 11387 11441 +54
Misses 12 12 ☔ View full report in Codecov by Sentry. |
Nope. black/flake8 is not needed for notebooks. Thanks for checking |
I will take a look at the notebook (click on the big dark purple button at the top of the page that says "ReviewNB"). Your best bet is to make your changes and push the notebook so that I can directly see what you are saying and we can comment (roughly) inline. |
| @@ -0,0 +1,241 @@ | |||
| { | |||
There was a problem hiding this comment.
So, it looks like you are manipulating the values within a column and then you are trying to stuff the results back into the same column of your dataframe. Unfortunately, you cannot do that via df.values[:, i] = X as df[:, i].values only allows you to access a copy of the values as a numpy array but, since it's a copy, it does not allow you to write back into the original Pandas dataframe. Would something like this work for what you are trying to achieve?:
# m was set to 4 hours m = 4 * 60padded_stddev = np.zeros(len(df)) # reusuable array filled with zeros
for colname in df.columns:
stddev = core.rolling_nanstd(df.loc[:, colname].values, m) # Compute rolling stddev. Constant regions will have a 0.0 stddev
padded_stddev[-len(constant_mask):] = stddev # Copy stddev into array that is pre-padded with (m-1) zeros
modified_values = df.loc[:, colname].where(padded_stddev != 0.0, np.nan) # Replace original value with np.nan where condition is False
df.assign(colname=modified_values)
Stepping through each line of the for-loop:
- This should look familiar as we are computing the stddev for a particular column. In Pandas, the preferred way to access the column (or Pandas series) by name is via the
locfunction where the first element corresponds to a list of named indices (in this case, our index is a timestamp) and then followed by a list of column/series names. In our case, we want to grab all rows (i.e., all timestamps) but only a single column at a time, so,df.loc[:, colname]specifies that all rows with:and only the column withcolnameshould be analyzed. The.valuesmakes sure to convert that column/series into a copy of anumpyarray for that column/series. Then, we pass that copy of values intocore.rolling_nanstd(a STUMPY function) and compute the rolling standard deviation. Of course, it is shortened bym-1values and so we'll need to eventually pad it with some additional values - Here, we use our pre-generated array that has been padded with
m-1zeros at the start and then we copy over our standard deviation values to fill in the rest of the array. So, the firstm-1values are all zeros and then followed by all of thestddevvalues - Then, we create a new array of
modified_valuesof thedf.loc[:, colname]series based on whether the each row ofpadded_stddevis equal/not equal to0.0. Note that the Pandas serieswherefunction assesses whether the condition provided as the first argument isTrueorFalse. WhenTrue, it keeps the value from the Pandas series. However, if the condition is found to beFalsethen it will assign the value in the second argument, which isnp.nanin this case. So, for each row ofpadded_stddev, if that row has a value that is not equal to0.0(i.e.,True), then keep the value from row in the the Pandas series. However, If the row inpadded_stddevis equal to0.0(i.e.,False), then replace the value in row of the Pandas series withnp.nan. Note that all of this is written out to a new Pandas series calledmodified_values - Finally, we assign the values of the series in
dfwith column namecolnamewith the our new Pandas seriesmodified_values
We could have combined steps 3 and 4 into one:
df.assign(colname=df.loc[:, colname].where(padded_stddev != 0.0, np.nan))
but this is a bit harder to digest/consume.
Please ask for any clarification and I would be happy to discuss this further.
Reply via ReviewNB
There was a problem hiding this comment.
Thank you very much! This was pretty useful for my understanding.
|
@SaVoAMP I came across this paper by Jessica Lin (who has worked with Eamonn Keogh in the past). If you look at Section D, I think that the PAMAP2 dataset (Overview found here - Download zip file here) may be good for our tutorial. In the paper, they focused on the "ironing" activity and used a 12.5 second (12500 data point) window size, which they claimed allowed them to identify relevant hand motions (from the Y and Z hand coordinates) that are consistent with ironing while, presumably, other coordinates (from the chest and ankles) may have been irrelevant for ironing. The dataset is suppose to contain 1.3 million datapoints in length which may be too much for a tutorial but I wonder if we could downsample the data by 10x (i.e., only look at every 10th data point and thereby analyzing only 130K data points for each dimension) and still get be able to convey our point. I wanted to bring it to your attention in case it may be useful. |
I'm not sure what data set would be better 🤔 Just added your suggestions to eliminate constant regions. Now we have much better results. But I'm not sure why there is not eliminated more of the 'zero'-regions in the Tumble Dryer and Washing Machine data. Maybe we get good results if I also eliminate regions where the power demand is zero, since this regions are not important? Or to you think that would do to much? |
I think we should exhaust our options fully before moving on. The key thing is that there is no way for anybody (including your or I) to know what the best option is until we try. The good thing is that there is no rush here. We should assess as we go. If you are willing, let's "try something and see what happens". Let me know if you are getting frustrated by anything or if there are any other ways that I can help. However, I see that you are a good problem solver too. Know that we are in this together! |
|
I also tried to eliminate those regions that are zero since they aren't interesting. Unfortunately this is eliminating too much and therefore the program doesn't work anymore. I think it might be generally difficult to find more than one motif with the dataset. Preprocessing alone is a major problem here. Either you eliminate too much or too little 😞 |
|
Let me take a look |
| @@ -0,0 +1,250 @@ | |||
| { | |||
There was a problem hiding this comment.
What if instead of setting things to np.nan, set things to random noise (adjust the mean/stddev for np.random.uniform accordingly) ?
m = 4 * 60 padded_stddev = np.zeros(len(df))for colname in df.columns:
noise = np.random.uniform(0.0, 0.1, size=len(df))
stddev = core.rolling_nanstd(df.loc[:, colname].values, m)
padded_stddev[-len(stddev):] = stddev
modified_values = df.loc[:, colname].where(padded_stddev != 0.0, noise)
df = df.assign({colname: modified_values})
zero_idx = df.loc[:, colname].where(df.loc[:, colname] != 0, noise)
df = df.assign({colname: zero_idx})
Reply via ReviewNB
There was a problem hiding this comment.
After this, I did:
mps, indices = stumpy.mstump(df.astype(float), m)
motifs_distances, motifs_indices, motifs_subspaces, motifs_mdls = mmotifs(
    df.astype(float), mps, indices, max_distance=np.inf, max_matches=2
)
I think we need to allow max_motifs=5 if we wanted to find more motifs as the default is max_motifs=1
There was a problem hiding this comment.
What if instead of setting things to np.nan, set things to random noise
That's a pretty good idea! Thank you!
I think we need to allow max_motifs=5 if we wanted to find more motifs as the default is max_motifs=1
Yes, I agree. But since we want to show as much of the mmotifs function as we can, I would do everything step by step. Or what would you say?
My suggestion would be to proceed as follows:
I would try to set different parameter combinations in mmotifs and try to find different things. For example we could try to find the first motif unconstrained (as it is now), explain how to choose the parameters in mmotifs to do so, plot the found motif and explain what we have done, in the first step. Afterwards we could do exactly the same steps but try to find a 2-dimensional motif (instead of the unconstrained one) for example. If we also have the 2-dimensional motif, we could search for its nearest neighbors (matches) and so on. And after that I would try to find some kind of story that explains what we are doing in each step and what we are finding / trying to find.
That means, that I would try to call mmotifs in different ways in order to explain our input parameters. Then I would plot what we have found and explain our findings. We also could show the MDL results after the unconstrained search, to show the user what mmotifs is doing if no k is set and explain that. And so on ...
I think it might be easiest to do the programming steps first, look what parameter combinations lead to meaningful results and write the context/explanation for the jupyter notebook at the end since it depends on the parameter settings.
What do you think?
num_motifs = motifs_distances.shape[0]
for motif_num in range(num_motifs):
motif_indices = motifs_indices[motif_num]
mdl = motifs_mdls[motif_num]
S = motifs_subspaces[motif_num]
subspace = [df.columns.values[s] for s in S]
k = len(S)
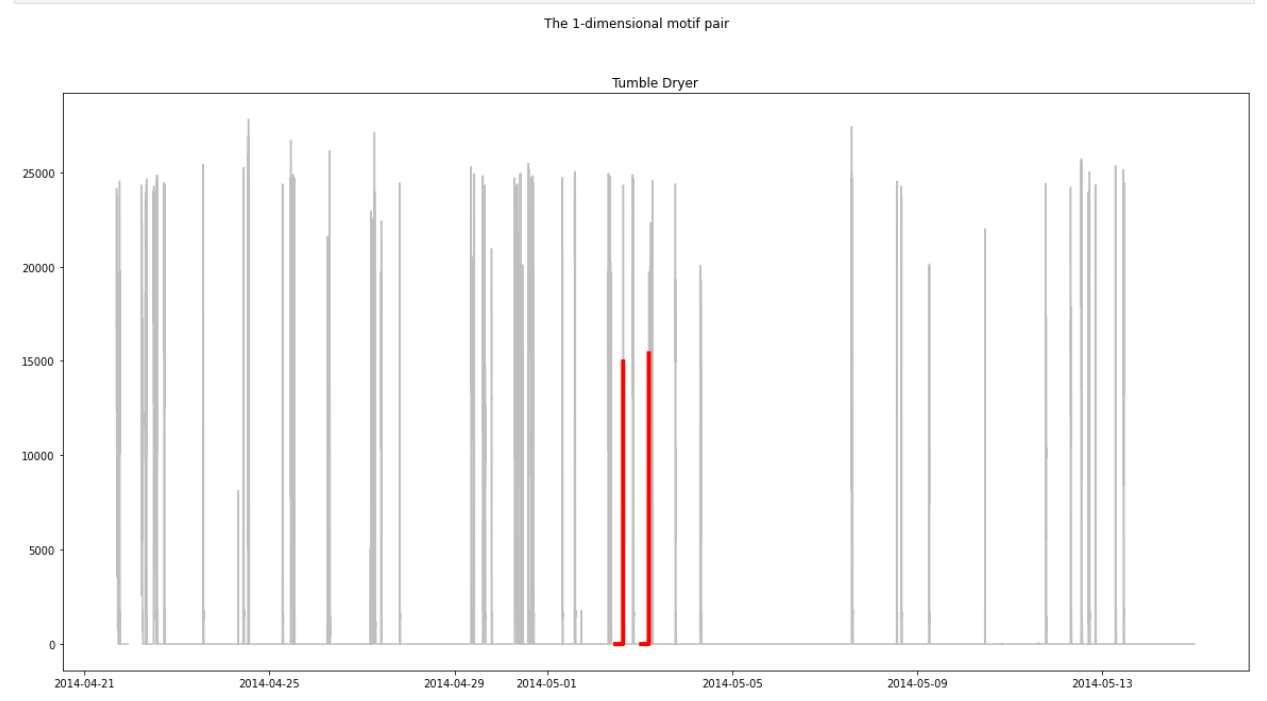
f, axs = plt.subplots(k, 1, figsize=(20, 20), sharex=True)
plt.suptitle(f"The {k}-dimensional motif pair")
for j, s in enumerate(S):
time_series = df[df.columns[s]]
if k > 1:
ax = axs[j]
else:
ax = axs
ax.plot(time_series, c="0.75")
ax.set_title(df.columns.values[s])
motif_idx = motif_indices[0]
nn_idx = motif_indices[1]
ax.plot(time_series[motif_idx : motif_idx + m], c="r", linewidth=4)
ax.plot(time_series[nn_idx : nn_idx + m], c="r", linewidth=4)
# ax.axvline(x=motif_idx, linestyle='dashed', c='k', linewidth=2)
# ax.axvline(x=nn_idx, linestyle='dashed', c='k', linewidth=2)
# Only relevant if you want to find further matches
# Set motif_indices[2:] to avoid double counting the motif pair
[ax.plot(time_series[match : match + m]) for match in motif_indices[2:]]
I think it might be useful to wrap that code in a separate function for this tutorial since it will be repeated many times. I'm asking because I haven't seen any function definitions in your tutorials yet. I would define the function at the beginning of the tutorial and explain that it will be used many times to visualize our results/findings.
There was a problem hiding this comment.
I think the first demonstration should always be calling the function with default parameters as it is the easiest and most straightforward:
mps, indices = stumpy.mstump(df.astype(float), m)
motifs_distances, motifs_indices, motifs_subspaces, motifs_mdls = mmotifs(df.astype(float), mps, indices)
So, you get something reasonable back with very little effort. Then, I would motivate the next step with "but this only gave us one motif and, at most, 10 matches", so how would we find more motifs beyond this first "top" one? And, by asking logical questions, we can motivate the introduction/need for the other parameters. I trust your judgement and don't want to overthink this. If you are open to feedback then I propose that we write the tutorial and then edit it as we go. It will take time but, ultimately, our users will benefit!
I'm asking because I haven't seen any function definitions in your tutorials yet. I would define the function at the beginning of the tutorial and explain that it will be used many times to visualize our results/findings.
You are very observant and thank you for asking! In general, for STUMPY code, I completely agree that we should write reusable functions rather than repeating ourselves everywhere. However, for tutorials, I personally hate needing to scroll all the way up to the top of the notebook in order to remember what the function does. I just can't keep it all in my head and I'd rather having all of the relevant code all in one place for a tutorial. Let me be absolutely clear that I'm not claiming to be "right" here but I think that by not defining functions in tutorials makes the barrier to entry a little lower for those who are new to Python. So the repeated code in our tutorials was not a lazy choice but one that was aiming to provide a more "inclusive"/"locally self-contained" programming approach. Considering that you've been a consumer of the tutorials, I'm open to your feedback and criticism as well! How do you feel about it? What are your thoughts?
There was a problem hiding this comment.
You are very observant and thank you for asking! In general, for STUMPY code, I completely agree that we should write reusable functions rather than repeating ourselves everywhere. However, for tutorials, I personally hate needing to scroll all the way up to the top of the notebook in order to remember what the function does. I just can't keep it all in my head and I'd rather having all of the relevant code all in one place for a tutorial. Let me be absolutely clear that I'm not claiming to be "right" here but I think that by not defining functions in tutorials makes the barrier to entry a little lower for those who are new to Python. So the repeated code in our tutorials was not a lazy choice but one that was aiming to provide a more "inclusive"/"locally self-contained" programming approach. Considering that you've been a consumer of the tutorials, I'm open to your feedback and criticism as well! How do you feel about it? What are your thoughts?
Since different visualizations were always chosen in the previous tutorials, I thought this made sense. However, I think that in a tutorial where you want to explain the functionality of a function by setting different parameters it may be clearer to define one visualization function since we are using exactly the same code many times (which was not the case in the previous tutorials) in order to explain how everything works and what the differences between the function calls are.
However, for tutorials, I personally hate needing to scroll all the way up to the top of the notebook in order to remember what the function does. I just can't keep it all in my head and I'd rather having all of the relevant code all in one place for a tutorial.
Generally I agree with you here. But in this specific case I think it might be easier/clearer to define a visualize() or show_matches() function. Such a function is so simple that I think the name says enough about it that everyone knows what is happening without having to scroll up for it 🤔
I think the first demonstration should always be calling the function with default parameters as it is the easiest and most straightforward:
Yes, that sounds reasonable! I wanted to make sure at the beginning that I actually get exactly one motif pair. I'll take a look if we get a solution with the default parameters (in my testing data I had to at least set the max_distance parameter in order to find a motif).
There was a problem hiding this comment.
However, I think that in a tutorial where you want to explain the functionality of a function by setting different parameters it may be clearer to define one visualization function since we are using exactly the same code many times (which was not the case in the previous tutorials) in order to explain how everything works and what the differences between the function calls are.
Such a function is so simple that I think the name says enough about it that everyone knows what is happening without having to scroll up for it
@SaVoAMP I trust your judgement. Go for it and let's see how it turns out!
Yes, that sounds reasonable! I wanted to make sure at the beginning that I actually get exactly one motif pair. I'll take a look if we get a solution with the default parameters (in my testing data I had to at least set the max_distance parameter in order to find a motif).
Sounds good!
There was a problem hiding this comment.
I'm not sure why but every time I rerun the notebook, I get different outputs, for example:
There was a problem hiding this comment.
This does sound strange. It implies that you may be overwriting your original data structures. Are your otifs_distances, motifs_indices, motifs_subspaces, motifs_mdls still the same when you re-run the notebook or are they changing after each re-run?
| @@ -0,0 +1,242 @@ | |||
| { | |||
There was a problem hiding this comment.
I don't think that it is wise to have a function with no inputs as this can cause unintended behavior. For example, in motif_indices = motifs_indices[motif_num] you are overwriting the global motif_indices that is outside of your function. You should really make a copy first and you should always pass in the latest motif_distances, motif_indices , df, etc.
def show_motifs_matches(df, motif_distances, motif_indices, ...)
Reply via ReviewNB
There was a problem hiding this comment.
Ok, thank you, I'll change it!
There was a problem hiding this comment.
Unfortunately this doesn't change anything and I still get different motifs. I have to take a closer look at this the next days. I don't like Jupyter notebooks since I am often debugging my way through all the code which is inconvenient with them in my opinion. So I resort to copy-pasting it to Pycharm and back as needed 😆
I can't lie, @SaVoAMP, I was really looking forward to seeing how you combine "Rap" and "visualization" 😸 |
Oh god, that is very embarrassing 😆 It's supposed to mean 'wrap' 🤣 |
…y into multi_motif_match_tutorial
|
Yes, that makes sense! |
…on vector to allow a meaningful motif discovery
|
@SaVoAMP Just checking in here. How are things going? |
|
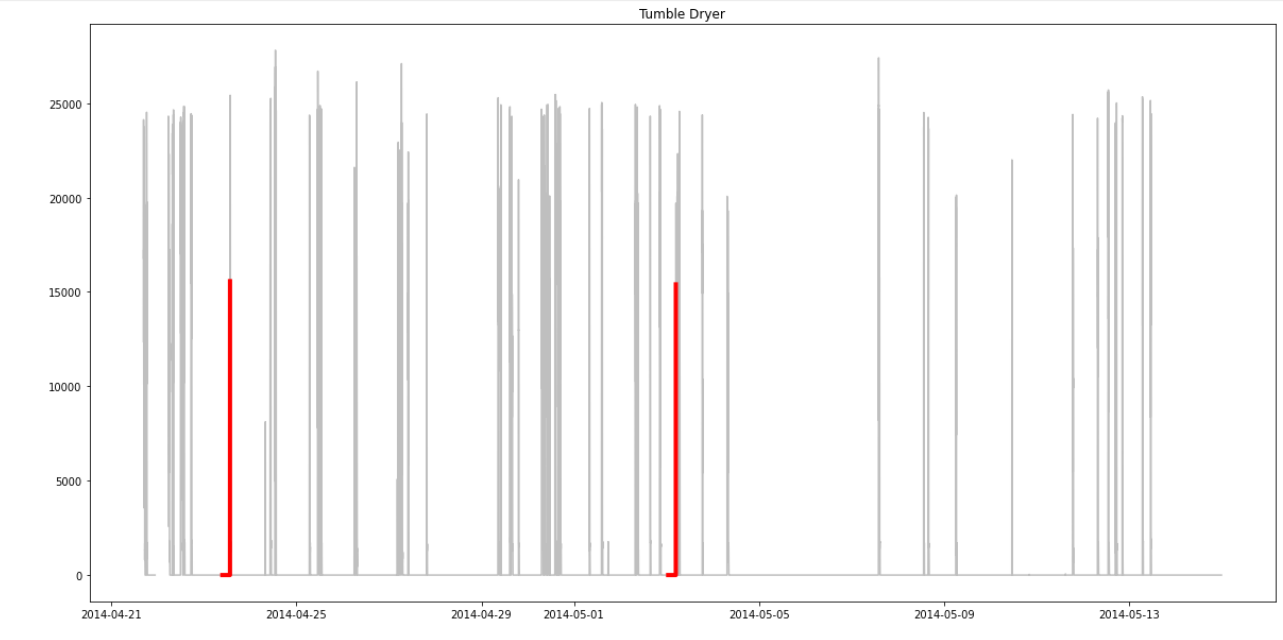
Hey, sorry, I was ill for a while 😞 I have already integrated your suggested Annotation Vector code and updated all of the text according to the motifs that are found with this new approach. I think that the new motifs make more sense than the old ones. However, the three-dimensional motif that is found in the "Constrained Search" section doesn't look really meaningful since many no-action regions are found for the matches. At this time I didn't find out why the "Comparing the motif with its nearest neighbors" plot only works sometimes. That's pretty strange 🤔 I think I have to check this with another IDE since I don't like to debug directly on jupyter notebooks 😆 By the way, do you have a programming task I could contribute to? Maybe something like developing the |
Oh no! Sorry to hear that. I hope you are getting better
At some point, if the process and results aren't clear then maybe we merge the tutorial and simply accept it in a "work-in-progress" state and allow people to discover it (or we point people to it that ask in the discussions) but, due to the lack of clarity, we don't add it to the Tutorial section. Maybe you'd agree that while the tools are reasonable, the example use case will likely cause more confusion. I think you've done a tonne of work and I also want to give you an opportunity to break from it as well. We've done this many, many times with other tutorials where we just didn't publish it (not because of lack of effort) but because it wasn't "ready" yet and, sometimes, it may never be. What do you think?
Cool.
I totally understand. I just looked at the open issues (and I recommend you take a look as well) but I don't see anythings as interesting/similar as developing |
|
Hi @SaVoAMP! How are you? I just wanted to check-in here and see how things were going? |
|
Hey 😃
Sorry, I interpreted the meaning of this message so that further work on this tutorial section may not be worth the effort. The only idea that comes to my mind regarding this tutorial would be to change the data set and thus redo the text of the tutorial section as well. |
|
@SaVoAMP I think the pragmatic thing to do is:
This way, your work can still be captured and anybody (including you) can take another stab at improving it in a future PR to this file (whether it's using the same dataset or something else). If you want to try it with another dataset then I would keep the PR separate. How does that sound? |
|
All right, that sounds good! Unfortunately I'll probably only get to do it on the weekend since I'm busy with my masters degree and work on weekdays. |
|
No problem! Thank you |
|
Hey, I'm sorry but I was very busy on the weekend with studying. But I promise that I'll get to do it as soon as I have some free time. 😃 |
No worries! Thank you for letting me know @SaVoAMP |
|
Uhh, this looks very interesting, especially since I particularly like to work with sports data. I'm very sorry that I have not found the time to go through the tutorial again yet. In addition to the currently quite stressful everyday life, I was also sick last week. I really hope to get to it this coming weekend! Probably it would make the most sense to work though your mentioned steps (17 days ago) first and experiment with the new data set afterwards as you already said?
These steps I think (and hope) I should be able to do soon.
This will probably take a while. I find the data set really exciting, but unfortunately I can't guarantee how fast I will make progress besides studying and working. If it continues to be this stressful, I may not be able to work on it decently until my exam period in late January / early February is over. Unless you just happen to have an idea how to combine some machine learning stuff with matrix profiles so that it has some use for stumpy (I'm currently looking for a project idea for a machine learning subject I have chosen) 😆. |
No worries! This is all volunteer and you are allowed to say, "I don't have the time" too.
Yes, I think that is the right plan. Finish this up and, separately (whether it is you or somebody else), we can explore the other dataset.
This is why I created a new issue. Sometimes, issues sit there and nobody has time/interest to work on them and that is okay. It's just a place to track thoughts/ideas and anybody can give it a try if they have the availability. No pressure.
I recommend that you post something in our Discussion section as others in the community may have some thoughts/suggestions! |
|
Today I took a closer look at the "comparing the motif with its nearest neighbors" plot. It seems to be correct after all. I enabled |
|
Great! If you are satisfied with it then I will merge this notebook after the tests complete? I will await your final confirmation @SaVoAMP |
|
Yes, I guess it's only worth to put more effort in it with a new data set (maybe a data set that doesn't have that many constant regions without a signal and therefore doesn't need so much preprocessing). |
|
Thank you for this work @SaVoAMP! We really appreciate it! |
…atches discovery tutorial
Pull Request Checklist
Below is a simple checklist but please do not hesitate to ask for assistance!
black(i.e.,python -m pip install blackorconda install -c conda-forge black)flake8(i.e.,python -m pip install flake8orconda install -c conda-forge flake8)pytest-cov(i.e.,python -m pip install pytest-covorconda install -c conda-forge pytest-cov)black .in the root stumpy directoryflake8 .in the root stumpy directory./setup.sh && ./test.shin the root stumpy directoryAdd Top-K Multi-dimensional Motif Discovery Tutorial #518