Generate metro-map-style SVG diagrams from Mermaid graph definitions with %%metro directives. Designed for visualizing bioinformatics pipeline workflows (e.g., nf-core pipelines) as transit-style maps where each analysis route is a colored "metro line."
pip install nf-metroconda install bioconda::nf-metroA pre-built container is available via Seqera Containers:
docker pull community.wave.seqera.io/library/pip_nf-metro:611b1ba39c6007f1pip install -e ".[dev]"Requires Python 3.10+.
Render a metro map from a .mmd file:
nf-metro render examples/simple_pipeline.mmd -o pipeline.svgValidate your input without rendering:
nf-metro validate examples/simple_pipeline.mmdInspect structure (sections, lines, stations):
nf-metro info examples/simple_pipeline.mmdRender a Mermaid metro map definition to SVG.
nf-metro render [OPTIONS] INPUT_FILE
| Option | Default | Description |
|---|---|---|
-o, --output PATH |
<input>.svg |
Output SVG file path |
--theme [nfcore|light] |
nfcore |
Visual theme |
--width INTEGER |
auto | SVG width in pixels |
--height INTEGER |
auto | SVG height in pixels |
--x-spacing FLOAT |
60 |
Horizontal spacing between layers |
--y-spacing FLOAT |
40 |
Vertical spacing between tracks |
--max-layers-per-row INTEGER |
auto | Max layers before folding to next row |
--animate / --no-animate |
off | Add animated balls traveling along lines |
--debug / --no-debug |
off | Show debug overlay (ports, hidden stations, edge waypoints) |
--logo PATH |
none | Logo image path (overrides %%metro logo: directive) |
--line-order [definition|span] |
from file | Line ordering strategy: definition preserves .mmd order, span sorts by section span (longest first) |
The --logo flag lets you use the same .mmd file with different logos for dark/light themes:
nf-metro render pipeline.mmd -o pipeline_dark.svg --theme nfcore --logo logo_dark.png
nf-metro render pipeline.mmd -o pipeline_light.svg --theme light --logo logo_light.pngCheck a .mmd file for errors without producing output.
nf-metro validate INPUT_FILE
Print a summary of the parsed map: sections, lines, stations, and edges.
nf-metro info INPUT_FILE
The examples/ directory contains ready-to-render .mmd files:
| Example | Description |
|---|---|
simple_pipeline.mmd |
Minimal two-line pipeline with no sections |
rnaseq_auto.mmd |
nf-core/rnaseq with fully auto-inferred layout |
rnaseq_sections.mmd |
nf-core/rnaseq with manual grid overrides |
The examples/topologies/ directory has 15 examples covering a range of layout patterns. See the topology README for descriptions and rendered previews.
A few highlights:
| Wide Fan-Out | Section Diamond | Variant Calling |
 |
 |
 |
| Fold Serpentine | Multi-Line Bundle | RNA-seq Lite |
 |
 |
 |
Input files use a subset of Mermaid graph LR syntax extended with %%metro directives. The format has three layers: global directives that configure the overall map, section directives inside subgraph blocks that control section layout, and edges that define connections between stations.
The full example is at examples/rnaseq_sections.mmd. Here's how each part works.
%%metro title: nf-core/rnaseq
%%metro logo: examples/nf-core-rnaseq_logo_dark.png
%%metro style: dark
title:sets the map title (shown top-left unless a logo is provided)logo:embeds a PNG image in place of the text titlestyle:selects a theme (darkorlight)
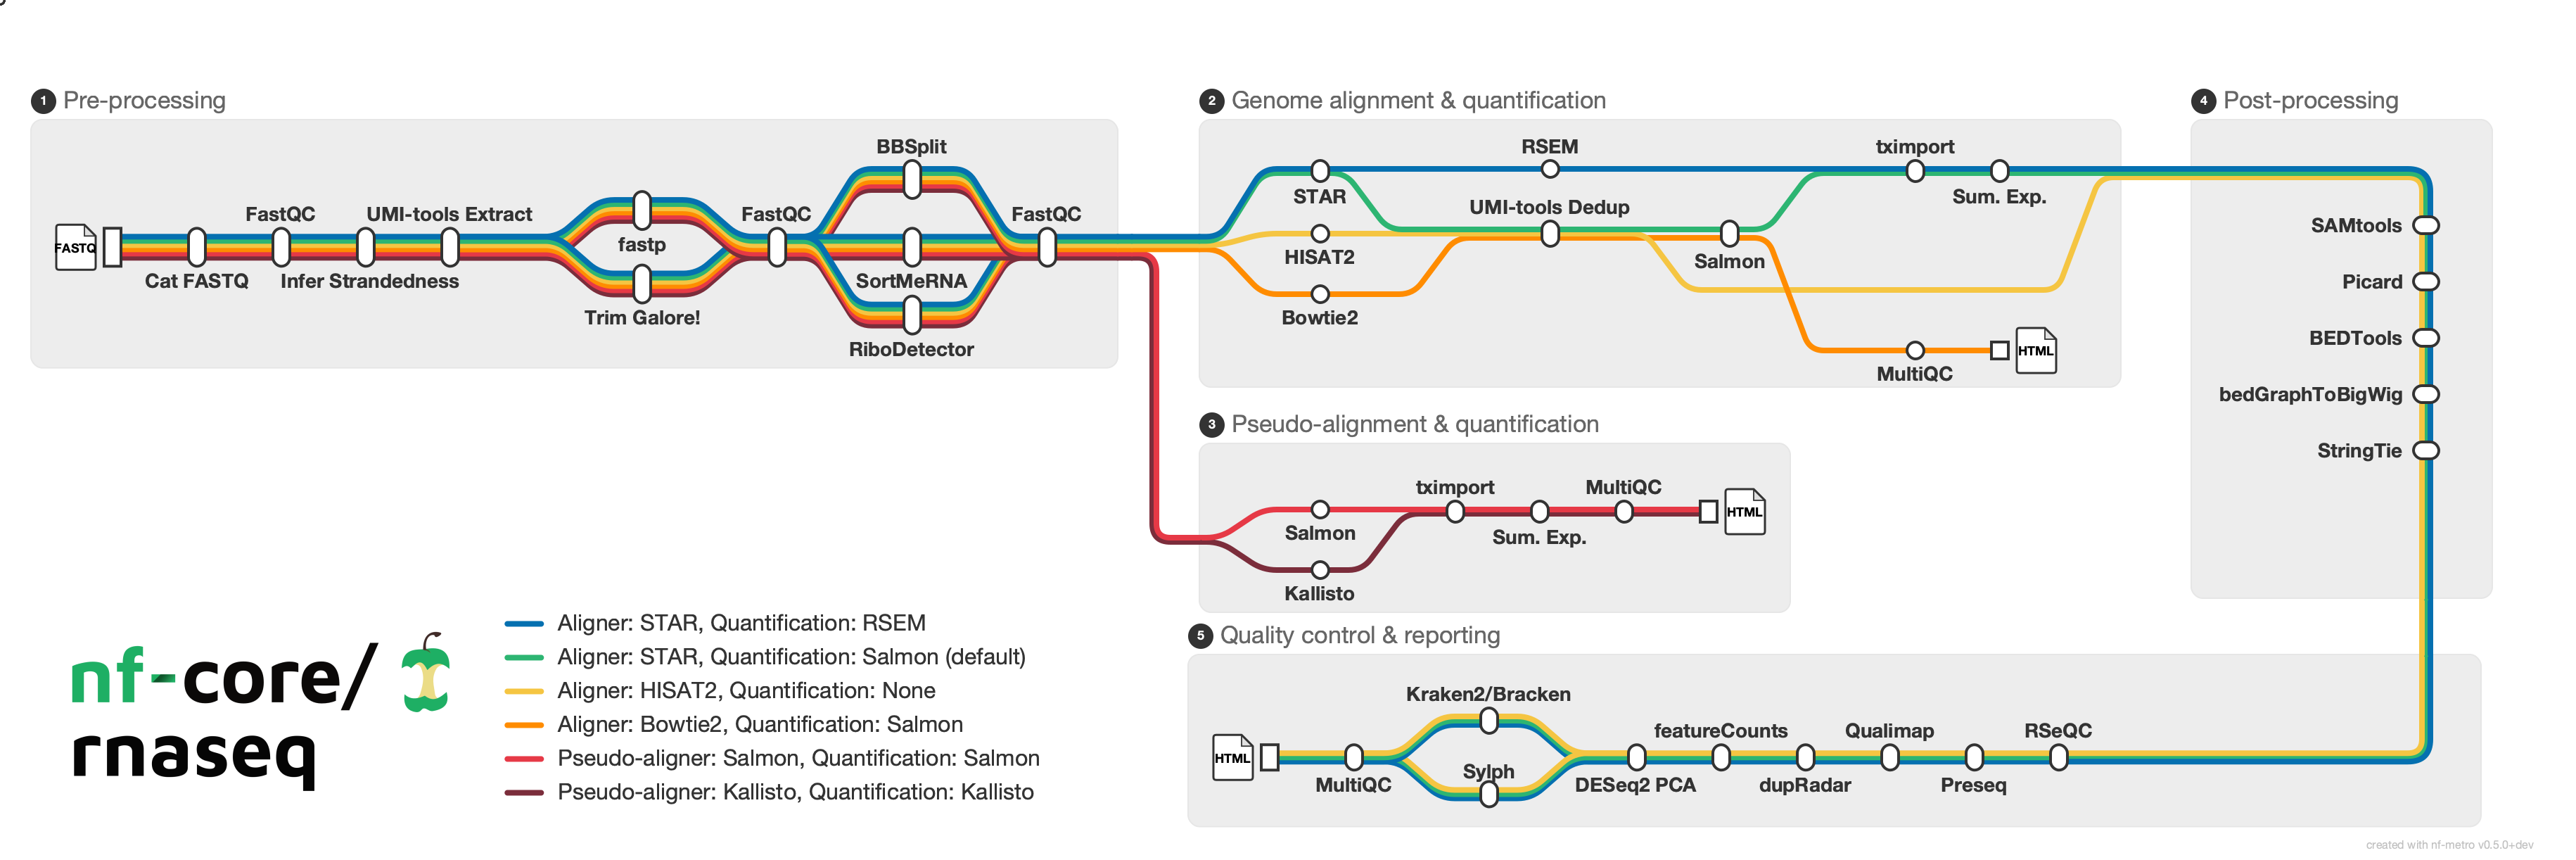
Each metro line represents a distinct path through the pipeline. Lines are defined with an ID, display name, and color:
%%metro line: star_rsem | Aligner: STAR, Quantification: RSEM | #0570b0
%%metro line: star_salmon | Aligner: STAR, Quantification: Salmon (default) | #2db572
%%metro line: hisat2 | Aligner: HISAT2, Quantification: None | #f5c542
%%metro line: pseudo_salmon | Pseudo-aligner: Salmon, Quantification: Salmon | #e63946
%%metro line: pseudo_kallisto | Pseudo-aligner: Kallisto, Quantification: Kallisto | #7b2d3b
In the rnaseq pipeline, each line corresponds to a parameter-driven analysis route. All five lines share the preprocessing section, then diverge based on aligner choice.
Sections are placed on a grid automatically via topological sort, but explicit positions can be set:
%%metro grid: postprocessing | 2,0,2
%%metro grid: qc_report | 1,2,1,2
The format is section_id | col,row[,rowspan[,colspan]]. In this example:
postprocessingis pinned to column 2, row 0, spanning 2 rows verticallyqc_reportis pinned to column 1, row 2, spanning 2 columns horizontally
%%metro legend: bl
Position the legend: tl, tr, bl, br (corners), bottom, right, or none.
Sections are Mermaid subgraph blocks. Each section is laid out independently, then placed on the grid:
graph LR
    subgraph preprocessing [Pre-processing]
        %%metro exit: right | star_salmon, star_rsem, hisat2
        %%metro exit: bottom | pseudo_salmon, pseudo_kallisto
        cat_fastq[cat fastq]
        fastqc_raw[FastQC]
        ...
    end
Section directives:
%%metro entry: <side> | <line_ids>- declares which lines enter this section and from which side (left,right,top,bottom)%%metro exit: <side> | <line_ids>- declares which lines exit and to which side%%metro direction: <dir>- section flow direction:LR(default),RL(right-to-left), orTB(top-to-bottom)
Entry/exit hints control port placement on section boundaries. A section can have exit hints on multiple sides (e.g., preprocessing exits right for aligners and bottom for pseudo-aligners), but all lines from a section leave through a single exit port. If all exit hints point to one side, that side is used; otherwise it defaults to right.
Most sections flow left-to-right (LR, the default). Two other directions are useful for layout:
Top-to-bottom (TB) - used for the Post-processing section, which acts as a vertical connector carrying lines downward:
    subgraph postprocessing [Post-processing]
        %%metro direction: TB
        %%metro entry: left | star_salmon, star_rsem, hisat2
        %%metro exit: bottom | star_salmon, star_rsem, hisat2
        samtools[SAMtools]
        picard[Picard]
        ...
    end
Right-to-left (RL) - used for the QC section, which flows backward to create a serpentine layout:
    subgraph qc_report [Quality control & reporting]
        %%metro direction: RL
        %%metro entry: top | star_salmon, star_rsem, hisat2
        rseqc[RSeQC]
        preseq[Preseq]
        ...
    end
Stations use Mermaid node syntax. Edges carry comma-separated line IDs to indicate which routes use that connection:
        cat_fastq[cat fastq]
        fastqc_raw[FastQC]

        cat_fastq -->|star_salmon,star_rsem,hisat2,pseudo_salmon,pseudo_kallisto| fastqc_raw
All five lines pass through this edge. Later, lines diverge:
        star -->|star_rsem| rsem
        star -->|star_salmon| umi_tools_dedup
        hisat2_align -->|hisat2| umi_tools_dedup
Here different lines take different paths through the section, creating the visual fork in the metro map.
Edges between stations in different sections go outside all subgraph/end blocks:
    %% Inter-section edges
    sortmerna -->|star_salmon,star_rsem| star
    sortmerna -->|hisat2| hisat2_align
    sortmerna -->|pseudo_salmon| salmon_pseudo
    sortmerna -->|pseudo_kallisto| kallisto
    stringtie -->|star_salmon,star_rsem,hisat2| rseqc
These are automatically rewritten into port-to-port connections with junction stations at fan-out points. You just specify the source and target stations directly.
| Directive | Scope | Description |
|---|---|---|
%%metro title: <text> |
Global | Map title |
%%metro logo: <path> |
Global | Logo image (replaces title text) |
%%metro style: <name> |
Global | Theme: dark, light |
%%metro line: <id> | <name> | <color> |
Global | Define a metro line |
%%metro grid: <section> | <col>,<row>[,<rowspan>[,<colspan>]] |
Global | Pin section to grid position |
%%metro legend: <position> |
Global | Legend position: tl, tr, bl, br, bottom, right, none |
%%metro line_order: <strategy> |
Global | Line ordering for track assignment: definition (default) or span (longest-spanning lines get inner tracks) |
%%metro file: <station> | <label> |
Global | Mark a station as a file terminus with a document icon |
%%metro entry: <side> | <lines> |
Section | Entry port hint |
%%metro exit: <side> | <lines> |
Section | Exit port hint |
%%metro direction: <dir> |
Section | Flow direction: LR, RL, TB |