White background for ipywidgets in dark themes #9403
Description
Environment data
- VS Code version: 1.65.2
- Jupyter Extension version (available under the Extensions sidebar): v2022.2.1030672458
- Python Extension version (available under the Extensions sidebar): v2022.2.1924087327
- OS (Windows | Mac | Linux distro) and version: Ubuntu 20.04.4 LTS
- Python and/or Anaconda version: Python 3.9.4
- Type of virtual environment used (N/A | venv | virtualenv | conda | ...): conda
- Jupyter server running: Local
Actual behaviour
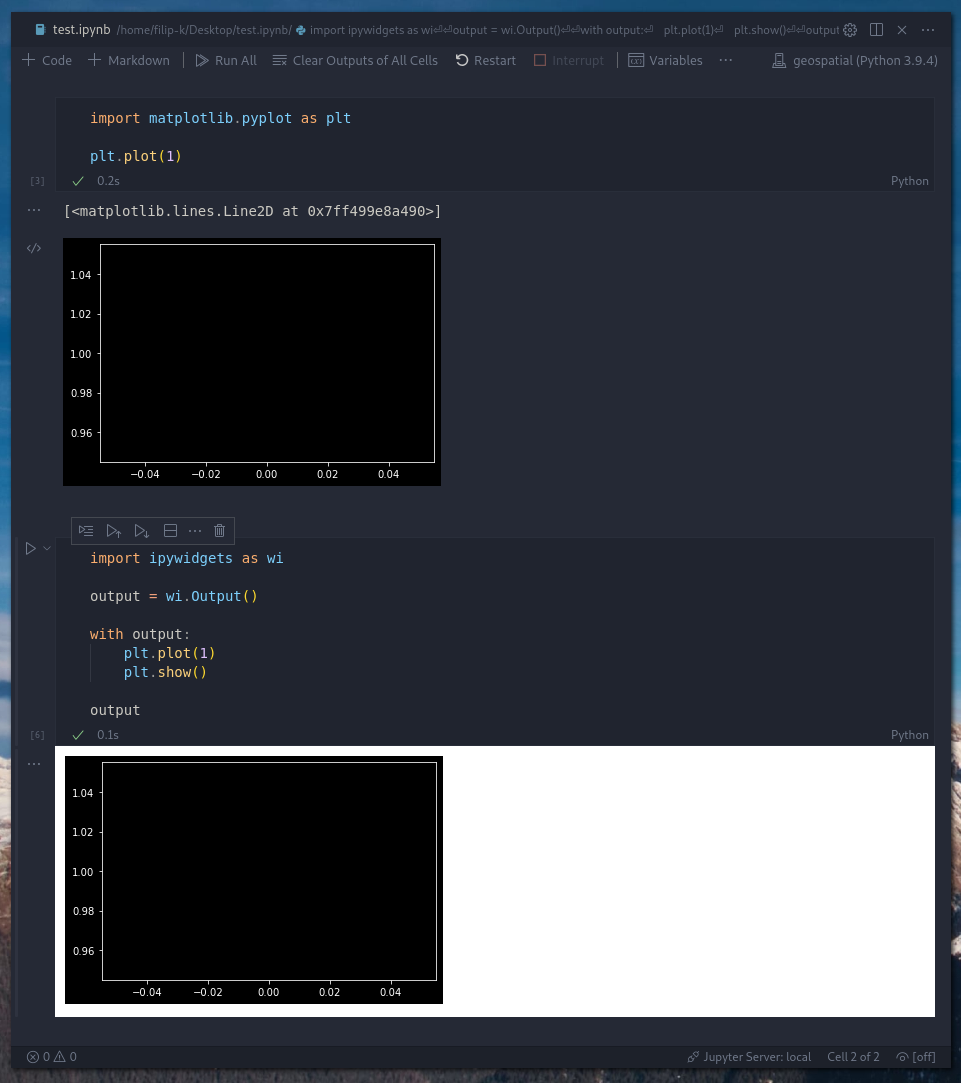
With the "Jupyter: Theme Matplotlib Plots" option enabled, matplotlib plots in jupyter are automatically inverted to be legible in a dark themes. This works well, but when the plot is in an ipywidget, the cell output is given a glaring white background, which is not needed (see screenshot).
Expected behaviour
Same output background as in cell 1.
Steps to reproduce:
import matplotlib.pyplot as plt
import ipywidgets as wi

output = wi.Output()

with output:
    plt.plot(1)
    plt.show()

output