Response times scatter plot #192
Merged
Conversation
This file contains hidden or bidirectional Unicode text that may be interpreted or compiled differently than what appears below. To review, open the file in an editor that reveals hidden Unicode characters.
Learn more about bidirectional Unicode characters
Codecov Report
@@            Coverage Diff            @@
##           master     #192     +/-   ##
=========================================
- Coverage   71.61%   71.42%   -0.2%
=========================================
  Files          45       45
  Lines        4245     4248      +3
  Branches      761      761
=========================================
- Hits         3040     3034      -6
- Misses        908      914      +6
- Partials      297      300      +3
Continue to review full report at Codecov.
|

artem-fedorov
approved these changes
Mar 5, 2020
Sign up for free
to join this conversation on GitHub.
Already have an account?
Sign in to comment
2 participants
Add this suggestion to a batch that can be applied as a single commit.
This suggestion is invalid because no changes were made to the code.
Suggestions cannot be applied while the pull request is closed.
Suggestions cannot be applied while viewing a subset of changes.
Only one suggestion per line can be applied in a batch.
Add this suggestion to a batch that can be applied as a single commit.
Applying suggestions on deleted lines is not supported.
You must change the existing code in this line in order to create a valid suggestion.
Outdated suggestions cannot be applied.
This suggestion has been applied or marked resolved.
Suggestions cannot be applied from pending reviews.
Suggestions cannot be applied on multi-line comments.
Suggestions cannot be applied while the pull request is queued to merge.
Suggestion cannot be applied right now. Please check back later.
The plugin currently publishes response time charts for the build based on the stored sample data, both on the
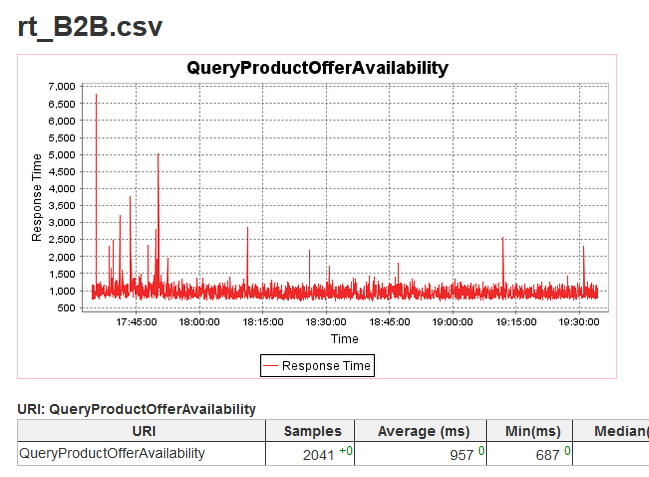
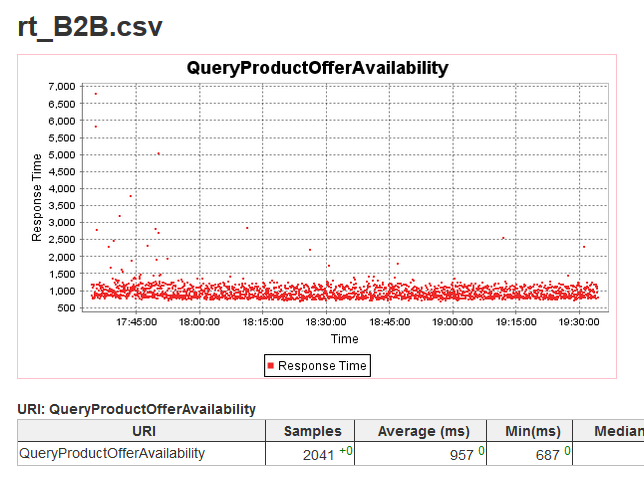
/performance/trendReportand/performance/uriReportpage.These charts are line charts, with each individual sample being plotted and connected with straight lines (first example below).
This is not ideal as it hides significant details (clustering, queuing, gaps, outlier etc.) and would be much better presented as scatter plot, i.e. individual dots without lines in between (second example below).
This PR implements this change, which is purely affecting presentation of the same data.