
mplsoccer is a Python library for plotting soccer/football charts in Matplotlib and loading StatsBomb open-data.
Use the package manager pip to install mplsoccer.
pip install mplsoccerOr install via Anaconda.
conda install -c conda-forge mplsoccerRead more in the docs and see some examples in our gallery.
Plot a StatsBomb pitch
from mplsoccer import Pitch
import matplotlib.pyplot as plt
pitch = Pitch(pitch_color='grass', line_color='white', stripe=True)
fig, ax = pitch.draw()
plt.show()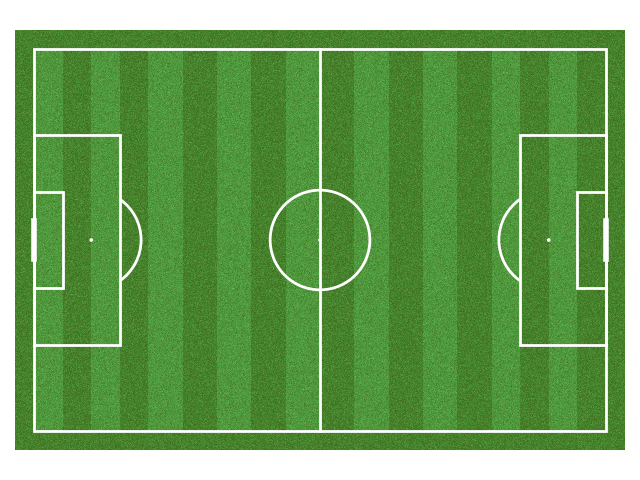
Plot a Radar
from mplsoccer import Radar
import matplotlib.pyplot as plt
radar = Radar(params=['Agility', 'Speed', 'Strength'], min_range=[0, 0, 0], max_range=[10, 10, 10])
fig, ax = radar.setup_axis()
rings_inner = radar.draw_circles(ax=ax, facecolor='#ffb2b2', edgecolor='#fc5f5f')
values = [5, 3, 10]
radar_poly, rings, vertices = radar.draw_radar(values, ax=ax,
                                               kwargs_radar={'facecolor': '#00f2c1', 'alpha': 0.6},
                                               kwargs_rings={'facecolor': '#d80499', 'alpha': 0.6})
range_labels = radar.draw_range_labels(ax=ax)
param_labels = radar.draw_param_labels(ax=ax)
plt.show()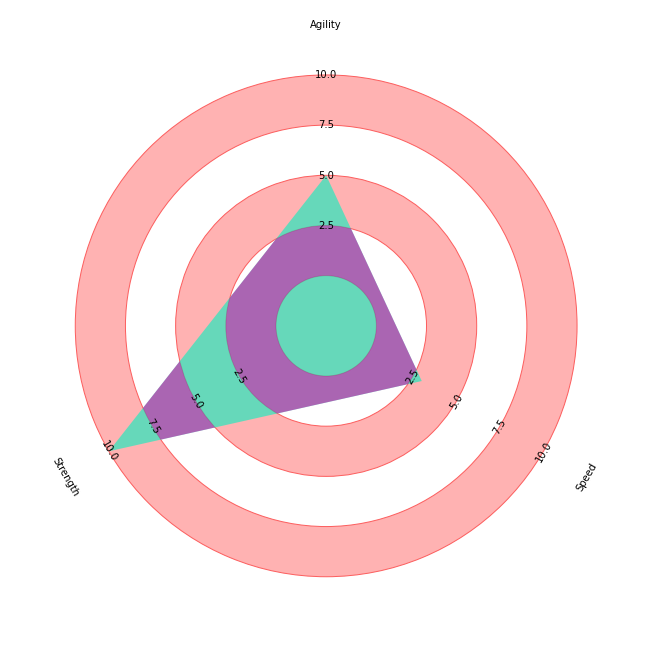
In mplsoccer, you can:
- plot football/soccer pitches on nine different pitch types
- plot radar charts
- plot Nightingale/pizza charts
- plot bumpy charts for showing changes over time
- plot arrows, heatmaps, hexbins, scatter, and (comet) lines
- load StatsBomb data as a tidy dataframe
- standardize pitch coordinates into a single format
I hope mplsoccer helps you make insightful graphics faster, so you don't have to build charts from scratch.
I would love the community to get involved in mplsoccer. Take a look at our open-issues for inspiration. Please get in touch at rowlinsonandy@gmail.com or @numberstorm on Twitter to find out more.
View the changelog for a full list of the recent changes to mplsoccer.
mplsoccer was inspired by:
- Peter McKeever heavily inspired the API design
- ggsoccer influenced the design and Standardizer
- lastrow's legendary animations
- fcrstats' tutorials for using football data
- fcpython's Python tutorials for using football data
- Karun Singh's expected threat (xT) visualizations
- StatsBomb's great visual design and free open-data
- John Burn-Murdoch's tweet got me interested in football analytics
Some mplsoccer development has been helped by Claude Code, with free access generously provided through Anthropic's Claude for Open Source program. If you maintain an open-source project, you can apply at claude.com/open-source-max.