Non-linear performance at larger batch sizes. #555
Description
Repro file:
The attached repro file (added with .txt so that GitHub will accept it) contains a hand-edited VGG16 model based on an ONNX model file from the ONNX model gallery.
The code relies on NNlib and CuArrays for the significant operations (pooling and convolution). The original weights file are almost 1GB in size, so I changed the code to generate random numbers for the weights.
I benchmarked the model across a number of different batch sizes.
This is a graph of the results: 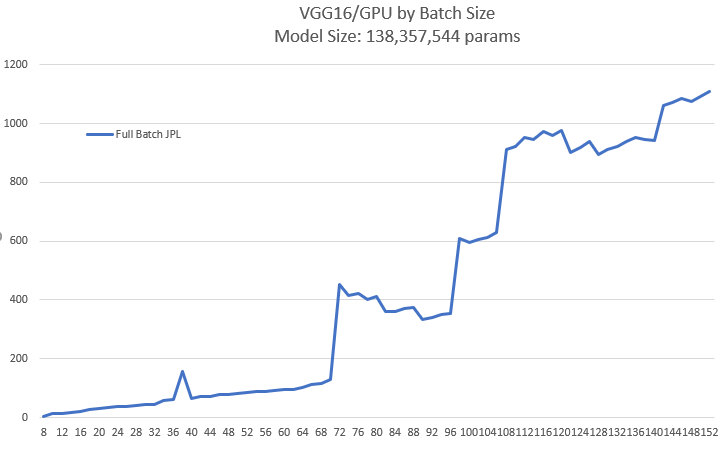 .
.
I noticed some strange performance issues.
First, there's an odd spike at N=38:
julia> fullbatch(36:1:40)
N = 36  62.850 ms (2994 allocations: 20.83 MiB)
N = 37  61.790 ms (2994 allocations: 21.40 MiB)
N = 38  161.827 ms (3039 allocations: 21.98 MiB)
N = 39  65.711 ms (2998 allocations: 22.55 MiB)
N = 40  66.615 ms (3001 allocations: 23.12 MiB)
Then, once you get to N=69 or 70 (it differs from run to run), the performance goes from more-or-less scaling linearly (with the N=38 exception) to wildly varying (and poor):
julia> fullbatch(68:1:73)
N = 68  130.874 ms (3020 allocations: 39.20 MiB)
N = 69  130.836 ms (3020 allocations: 39.78 MiB)
N = 70  131.772 ms (3026 allocations: 40.35 MiB)
N = 71  477.422 ms (3139 allocations: 40.93 MiB)
N = 72  471.267 ms (3133 allocations: 41.50 MiB)
N = 73  448.079 ms (3126 allocations: 42.08 MiB)
I assume that this has something to do with automatic memory management in CuArrays.jl, but I'm only a user, so I really don't know how to approach analyzing this problem or even understanding whether it is my code that is too naïve. I do take care to use in-place operations when possible, but that may not be enough.
This is run on Windows 10 with a NVIDIA RTX 2080 SUPER GPU.